Sun Shines On Notts - Solar Transplants For Company That Died Twice
A company that has gone bust twice in a matter of years and left hundreds of employees out of work has been saved as the directors of Solar Windows have...
Read Full Article
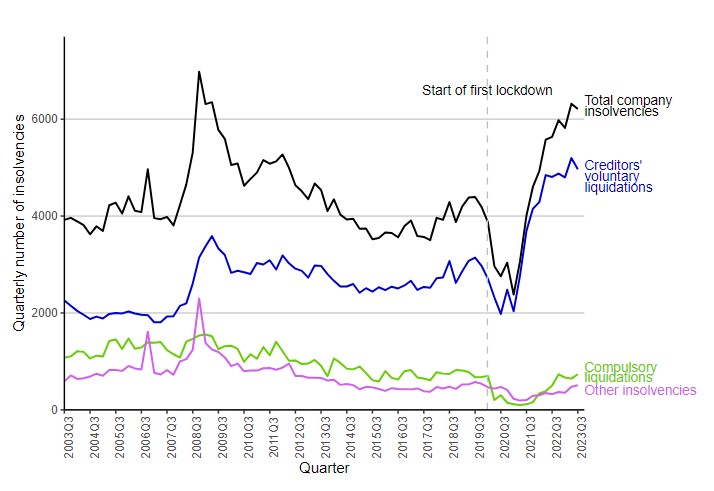
There have been 12,527 company insolvencies in the past six months, which is the highest level since 2009 and there have been 10,162 creditors’ voluntary liquidations in the same period – the highest since 1960.
One in 191 active companies entered liquidation over the last year – with the rate per 10,000 companies rising 11.7% year-on-year.
Nicholas Hyett, an investment manager at the Wealth Club said when analysing the figures produced by the Insolvency Service: “The steady upwards movement in interest rates is all about restricting demand, reining in corporate and consumer spending by increasing the cost of debt.
“However, inevitably there are some companies that will either struggle to service higher interest rates or for whom a slight fall in consumer spending is enough to wipe out profits altogether. The result, unsurprisingly, is a spike in companies falling into insolvencies – the highest level since the financial crisis. It won’t be news to anyone who’s walked down a high-street recently that cafes, restaurants, hotels and retailers have been hit particularly hard but we are also seeing big companies in the construction and construction supply chain getting into difficulties.
“Two big steel fabricators went bust in the past few days and so has household name Safestyle Windows. Companies that are too highly exposed could find trading more and more difficult.”
Bank of England
The BoE is due to meet again this week to decide on the longer-term future of interest rates. Hyett says: “There’s a degree of pain that policy makers are willing to tolerate. But there comes a point where the cure is worse than the disease and the economy starts to slide. Of course, inflation is also likely to be under control by that point, yet the Bank will want to minimise the amount of economic damage where it can, leaving it with a delicate balancing act to achieve.”
Covid protection
From the start of the Covid pandemic until mid-2021, numbers of company insolvencies were low when compared with pre-pandemic levels. This is likely to have been driven in part by government fiscal and other measures that were put in place to support businesses. This support may have artificially sustained companies that would otherwise have ceased trading sooner.
Picture: The insolvency graph with thanks to the Insolvency Service.
www.gov.uk/government/organisations/insolvency-service
Article written by Cathryn Ellis
02nd November 2023